What I learned building a Power BI report with AI and MCP
An experiment in model development, report design and validation—with synthetic data throughout.
I wanted to explore a practical question: how much of Power BI report development could an AI assistant help with if it could inspect the model, make changes and test its work?
Writing DAX in a chat window is useful. Connecting an assistant to the actual model creates a different workflow. It can discover the tables and measures that exist, apply changes and run queries to check the results.
For this experiment, I combined Microsoft’s Power BI MCP server with direct editing of Power BI report files. I built a small hospital-activity example, added reusable measures, created two report pages and asked the assistant to audit the calculations.
The most valuable lesson was how these tools could support a more structured development process: inspect, change, validate and review.
About the data: Every record in this experiment was fictional. No patient records or real hospital activity were used.
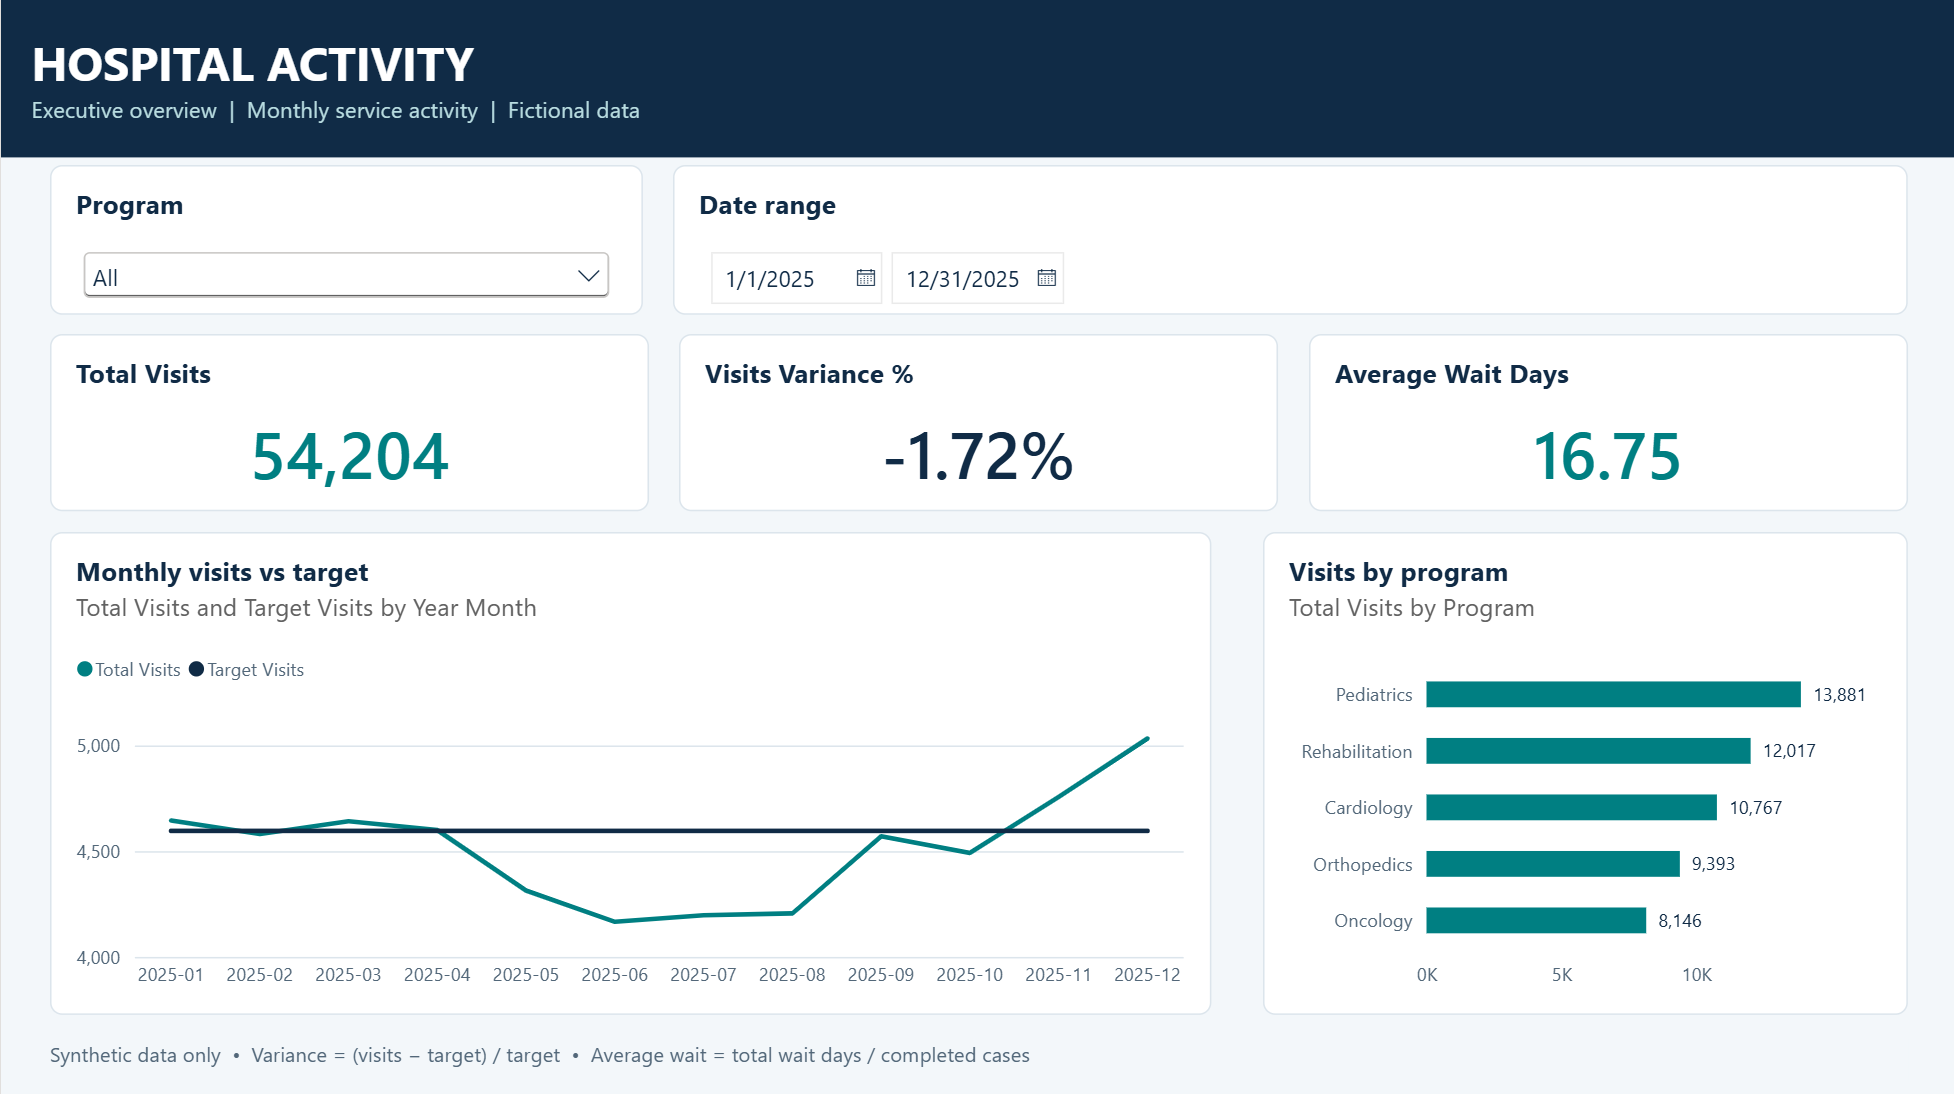
The Executive Overview, filtered to 2025 and using fictional hospital activity. Its figures differ from the full 2024–2025 audit below because of the date filter.
Starting with a small, understandable model
I started with a CSV containing 24 months of monthly activity for five fictional hospital programs: 120 rows in total.
The dataset was deliberately simple:
Month: The reporting month, represented by its first date
Program: The fictional hospital program
Visits: Recorded visits for that month and program
TargetVisits: Planned visits for the same period
TotalWaitDays: The combined waiting days associated with completed cases
CompletedCases: The number of completed cases used to calculate average wait
This gave me enough variety to test filtering, monthly trends, percentage calculations and weighted averages, while keeping the expected results understandable.
I also separated the work into stages. The first instruction was to connect, inventory the model and run a basic query—without changing anything. Only after that did I ask for measures and relationships.
That sequence mattered. It established what the assistant could actually access before giving it permission to modify the model.
What MCP contributed
MCP stands for Model Context Protocol. It gives an AI application a standard way to call tools exposed by another system.
In this experiment, the Power BI MCP server provided the model operations. The AI assistant decided which tools to call based on my instructions.
Microsoft’s official server is now documented as the Power BI Authoring MCP server. Its capabilities include inspecting and modifying semantic models and executing DAX queries during development. The local deployment supports models open in Power BI Desktop. Microsoft’s authoring documentation
The division of work looked like this:
AI assistant: Interpreted instructions and coordinated the work
Power BI MCP server: Inspected the model, created model objects and executed DAX
File-editing tools: Edited the report’s PBIR definitions
Power BI Desktop: Loaded the project and provided the rendered report for human review
This distinction helped me make more precise requests. Model changes went through MCP. Report visuals were handled through project files.
The date table, activity fields and reusable measures visible in Power BI Desktop.
Building measures that work at different levels
I asked the assistant to create five measures:
Total Visits =
SUM('hospital_activity'[Visits])

Target Visits =
SUM('hospital_activity'[TargetVisits])

Visits Variance =
[Total Visits] - [Target Visits]

Visits Variance % =
DIVIDE([Visits Variance], [Target Visits])

Average Wait Days =
DIVIDE(
    SUM('hospital_activity'[TotalWaitDays]),
    SUM('hospital_activity'[CompletedCases])
)
It also added a date table and a relationship to the activity table.
The formulas were straightforward, but two deserved particular attention: variance percentage and average wait.
A total percentage should be calculated from the totals. Adding the percentages for individual programs—or taking their simple average—would answer a different question.
Average wait has a similar issue. Programs have different numbers of completed cases, so each program’s average should not receive equal weight. The calculation needs to divide total waiting days by total completed cases in the current filter context.
This became one of the strongest examples of where an assistant could help: it could explain the intended calculation, inspect the measure definition and run queries to compare the results.
Testing the numbers
I asked for an audit covering relationships, date coverage, month sorting and measure behaviour at different levels of detail.
The audit included checks for:
Duplicate keys on the date side of relationships.
Activity dates without matching date-table values.
Duplicate month-and-program combinations.
Visits and targets by month and program.
Percentage calculations at subtotal and grand-total levels.
Weighted waiting-time calculations.
Continuous date coverage and chronological sorting.
For the synthetic dataset, the overall results were:
Activity rows: 120
Total Visits: 106,120
Target Visits: 108,192
Visits Variance: −2,072
Visits Variance %: −1.9151%
Total Wait Days: 1,117,538
Completed Cases: 65,518
Average Wait Days: 17.0570
The waiting-time check illustrated why the formula matters. Dividing total wait days by completed cases produced 17.0570 days. Taking a simple average of the five program averages produced approximately 18.3363 days.
Those are materially different results.
A compact query for checking the overall measures was:
EVALUATE
ROW(
    "Rows", COUNTROWS('hospital_activity'),
    "Total Visits", [Total Visits],
    "Target Visits", [Target Visits],
    "Visits Variance %", [Visits Variance %],
    "Average Wait Days", [Average Wait Days]
)
The detailed checks also compared results across months and programs, rather than relying only on one grand total.
Checking the full dataset and comparing weighted wait time with the simple mean of program averages. The results grid displays the waiting-time values rounded to two decimal places.
There is an important limit to this result: the audit demonstrated internal consistency. It did not establish accuracy against an external operational source. No external source reconciliation was performed as part of that audit.
Building report pages through PBIR
The visual side of the experiment used PBIR, Power BI’s report definition format.
PBIR exposes report components through structured files, making it possible to inspect and edit report definitions with code tools. The report definition also contains the reference to its semantic model, which must be preserved. Microsoft’s report-folder documentation
The first page was an Executive Overview containing:
KPI cards for Total Visits, Visits Variance % and Average Wait Days.
A monthly Visits versus Target chart.
A Visits by Program bar chart.
Program and Date slicers.
The second page, Program Detail, reused the existing measures and added a program matrix alongside the monthly trend and slicers.
For that second page, I explicitly required the assistant to inspect the actual model names and existing file structure, preserve the existing pages, avoid semantic-model changes and validate the edited JSON against the applicable schemas.
The Program Detail page reuses the existing measures across a monthly trend and program matrix, with the full 2024–2025 date range selected.
This suggests a useful development pattern: establish the model and measures first, then reuse them consistently across report pages.
The less glamorous lessons mattered too
The workflow was not frictionless.
One issue was getting external file changes to appear in an already-open Power BI project. Editing a file on disk does not guarantee that the open Desktop session is displaying the updated version. Applying external changes or reopening the project became a separate step to verify.
Another lesson was that schema validation and visual review answer different questions.
A JSON file can pass its schema checks while still producing a report that needs attention. Labels may be cramped, chart settings may be inappropriate or interactions may not behave as intended.
For the Program Detail work, the assistant validated the files but did not inspect the rendered page. I kept that distinction explicit rather than treating successful validation as proof that the report looked correct.
The report project folder in File Explorer, including the definition folder that contains the PBIR report components.
Where this could improve report development
I see several practical opportunities.
Faster model discovery. An assistant can inventory tables, relationships and measures before proposing a change. That could reduce time spent manually tracing an unfamiliar model.
More consistent implementation. Measures can be created with deliberate names, formats and descriptions, then reused across pages.
More systematic validation. Repeating checks for relationships, totals, date coverage and filter behaviour could become part of the normal development workflow.
More reviewable report changes. PBIR edits can make it easier to identify which pages or visuals changed and bring report development into a file-based review process.
Better handoffs. The same inspection work can support documentation of what a model contains, how its measures work and what was tested.
These are potential benefits, not measured productivity claims. I did not run a controlled comparison or establish a percentage reduction in development time.
What I learned about data protection
The experiment also raised a question that matters well beyond Power BI: where does the data go when an AI assistant uses a tool?
A locally running MCP server does not guarantee that all processing stays local. Query results and model metadata can be returned to the AI client and forwarded to its configured model provider. Read-only access still involves data movement. Microsoft’s MCP data-handling guidance
I also explored how this relates to Microsoft 365 Copilot’s enterprise data protection. The key lesson was that protection needs to be assessed across the complete integration. Using an agent inside M365 Copilot does not automatically give every connected service identical contractual coverage. Microsoft directs customers to review agents’ terms, and its Power BI integration documentation distinguishes Fabric’s commitments from Copilot’s. M365 enterprise data protection · Power BI integration terms
I did not test this development workflow inside M365 Copilot. That part of the exploration was a documentation review, not a demonstrated implementation.
The workflow I would carry forward
My next experiment would follow the same basic sequence:
Start with synthetic or otherwise approved data.
Inspect the model before changing it.
Make a small, clearly scoped change.
Validate calculations across relevant filter contexts and totals.
Review the report-file changes.
Load the project and inspect the rendered pages.
Reconcile against source data when making claims about real-world accuracy.
What interested me most was the ability to turn a request into something inspectable: a measure definition, a DAX result or a report-file change.
That gives report developers more concrete material to review—and a practical way to use AI while keeping responsibility for the final report.