I gave an AI coding agent 24 hours to build a business intelligence tool
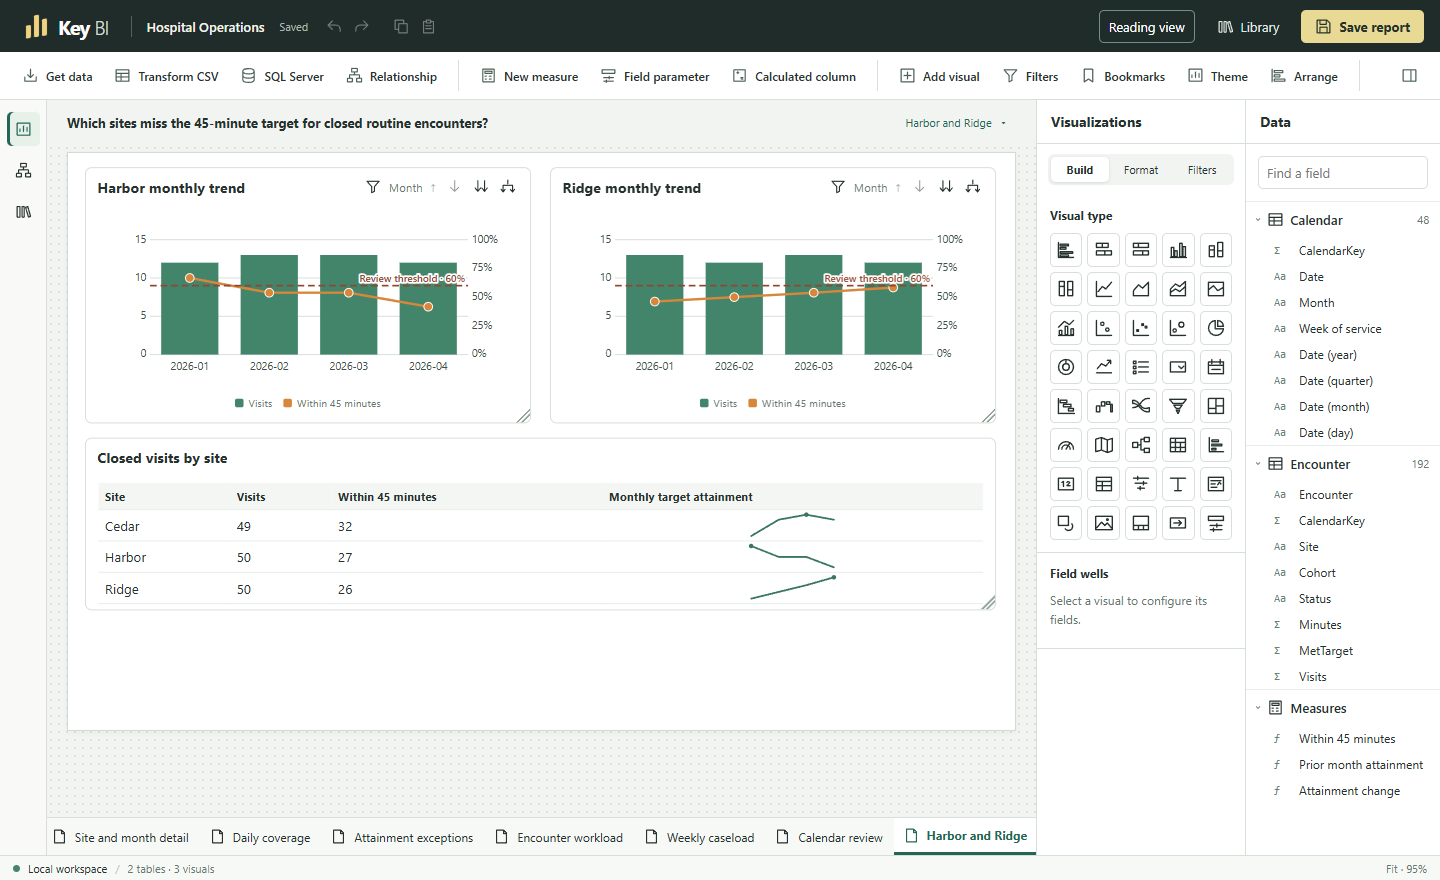
I wanted to see how much of the work I do in Power BI I could reproduce in a local browser app. Could I bring my own files, connect tables, write a measure, and build a report that someone else could open and investigate? I used Codex to build it, gave the project a 24-hour execution budget, and used Power BI Desktop as the reference for how authoring should feel. The result is KeyBI. It started under the name Folio Studio.
The model, the prompt, and the missing stop rule
I ran the experiment in Codex with OpenAI’s gpt-6.2-astra model and reasoning effort set to high. I specified the authoring workflow and performance targets. The agent could edit the Rust and browser code, build the application, generate test data, and exercise reports in Chrome. One instruction in the original prompt sums up the first assignment:
“Build one complete reporting workflow first. Start with import → chart → filter → save → reopen.”
That workflow needed a revenue chart, a margin card, a detail table, and a date filter. The first dataset contained two sales. I could check the expected margin in my head. It was 13% overall, 40% for one category, and 10% for the other. If I selected a category and its sale date, then cleared only the category, the date still had to constrain the result. Saving and reopening the report had to preserve that choice.
After that, the prompt told the agent to choose the next problem by building a report in the browser. Wrong numbers and lost work came first. To keep a change, it had to repeat the task and check the result against a hand calculation or an independent query. This gave the agent a way to judge each change. I’d left it without a way to judge when the whole project was finished. As the ambition grew to include Power BI Desktop and Service, there was always another reasonable feature to build. Partway through the run, I set the 24-hour limit on cumulative execution, including the time already spent.
What came out of the run
KeyBI runs on a local Rust server. Apache DataFusion queries imported data stored as Parquet, and the browser requests the totals or rows each visual needs. That keeps the million-row sales table on the server even when a reader is clicking around a chart. Power BI informed the canvas, field controls, and filters. The underlying implementation is independent.
An author can import Excel, CSV, or Parquet files, merge tables, reshape columns, define relationships, and write reusable measures in a subset of DAX. Starting from a blank page, they can build charts, tables, and matrices, add filters and drillthrough, design a phone layout, and export an editable report with its data in a single .keybi file.
By the final checkpoint there were six editable reports spanning 63 pages, all built with synthetic data. Sales tested whether margins survived filtering. Hospital Operations connected a monthly performance figure to the encounters behind it. Two wait-time reports explored the patients with the longest waits and the clinics that rose to the top as the review period changed. A visual gallery exercised the chart families. The budget report produced my favorite example of why all those pieces belong in one tool.
Across the organization, spending was $2,354 under budget. Facilities alone was $1,132 over. On the April page, an analyst could select $1,273 of Facilities spending and open the two ledger postings behind it. That month had no corresponding budget line. Getting from an apparently comfortable total to those two transactions took relationships, a calculation that handled missing data, a matrix, and drillthrough that remembered which cell the reader had selected. I could also open that report in a clean workspace and keep editing it.
How fast was it?
On a four-visual report with one million sales, I wanted a saved report to open in under two seconds and a filter to update the page in under 250 milliseconds at the 95th percentile. The clock started at the user’s input and stopped after the last affected visual displayed the correct answer.
The final build imported the sales CSV in 932 milliseconds and opened the saved report in 414 milliseconds. Across 48 filter selections, the 95th-percentile update took 25.7 milliseconds. That was in Chrome on a Ryzen 7 5700X3D machine with 64 GB of RAM, using a fresh server and browser profile for the open test and a warm operating-system file cache. I still owe the experiment an equivalent run in Power BI Desktop. Its speed relative to KeyBI is an open question.
What failed along the way
The sales example was too forgiving. It had one table of transactions. The budget report had two, with spending and budgets recorded at different levels of detail. When the agent tried to build it from a blank canvas, the relationship dialog offered only three of the four valid connections, and the visual picker had no matrix for the statement. Fixing that meant changing how the engine validated relationships and aggregated each table. The check then reconciled twelve detail groups, three department subtotals, and the grand total, including cases where one side had no entry. The original sales report could have stayed green through all of that.
The first speed test had a blind spot, too. On a second million-sale report, selecting particular pairs of sales cohorts and months took 516 and 529 milliseconds the first time. Narrowing the calendar before joining it to sales brought the same two clicks down to 79 and 75 milliseconds. All 24 monthly margins still agreed with an independent pass over the CSV. Those are two observed improvements on that report. I’d need more selections to characterize its usual response time.
What the experiment leaves open
One gap I noticed when I opened the Format pane was how many visuals offered fewer settings than their Power BI counterparts. Take the hospital chart at the top of this article. KeyBI can put visit counts on the columns and a percentage on the line, give each measure its own number format, and draw the review threshold. Suppose I want the labels on that line to show whole percentages while keeping an extra decimal place for the same measure elsewhere. Power BI lets an author override the format for the data labels alone. KeyBI’s measure presets get the units right, but it still lacks that label-level override and custom format strings. Microsoft’s guide to custom format strings.
The budget matrix exposed a different limit. I can color a variance cell according to its value and choose the endpoints of the color scale. Those endpoints stay fixed when a reader filters to one department. If I want the lightest and darkest shades to follow the range of the selected department, that option is missing. Counting the charts in the gallery made the project look further along than it felt when I tried to finish a report to a particular design.
An analyst starting with an Excel workbook can take it a long way in KeyBI. An analyst starting with an existing Power BI .pbix report would have to rebuild it, and some DAX measures would need rewriting. A local read-only snapshot works for reviewing a report on the same installation. A team that needs separate author and viewer permissions in a hosted workspace still needs that infrastructure. The SQL Server connector generates queries, but the run ended before it was verified against a live database.
There’s also a limit to what my tests say about usability. The original prompt asked for an experienced Power BI author to succeed without a tutorial. The automated checks drove Chrome using the same controls an author sees. They establish that a sequence of clicks works. They leave open whether someone seeing KeyBI for the first time would discover that sequence. The reports also used synthetic data, and the headline timings came from one machine.
What I’d test next
I’d make visual fidelity part of the next authoring test. Give an analyst the finished hospital chart and budget matrix as references, then ask them to recreate both from a blank page. I’d record which settings they can find, which details require a workaround, and which they have to leave out. That would give me a reason to prioritize a particular formatting control before adding another chart type.
First, I’d give an analyst the same recurring report to build in KeyBI and Power BI Desktop, using the same files and machine. I’d record where they hesitate, how long it takes to get the right totals, and how quickly both tools respond to the same filters. That one exercise would show me how familiar the authoring experience feels and where either tool has a measurable speed advantage.
For the next engineering task, I’d use a month-end receipts register. An author should be able to turn its rows into monthly columns, refresh it when a new month arrives, and reconcile every column with the ledger. I’d call that task finished when I could hand the analyst the following month’s file and watch them update the report without rebuilding it.